


As is often the case historically, September is not a good month for financial markets and for Bitcoin (BTC) due to seasonal issues. What happens is that in the northern hemisphere summer is ending and economic activities are paralyzed due to the holidays.
In this context, many are wondering What will happen to the price of the digital currency created by Satoshi Nakamoto for the remainder of 2024 or why it has not entered into a bullish rally after the halvingthe asset issuance reduction event.
One technical analysis tool that could shed light on this uncertainty is the Net Unrealized Profit and Loss (NUPL) indicator. Specifically, it serves to identify potential changes in the trend.
It is worth clarifying that the NUPL indicator, as seen in the following graph, detected the historical highs that were recorded in 2017, 2021 and 2024.


In the platform tool TradingViewthe areas painted in green, yellow and red that give the NUPL value can be seen:
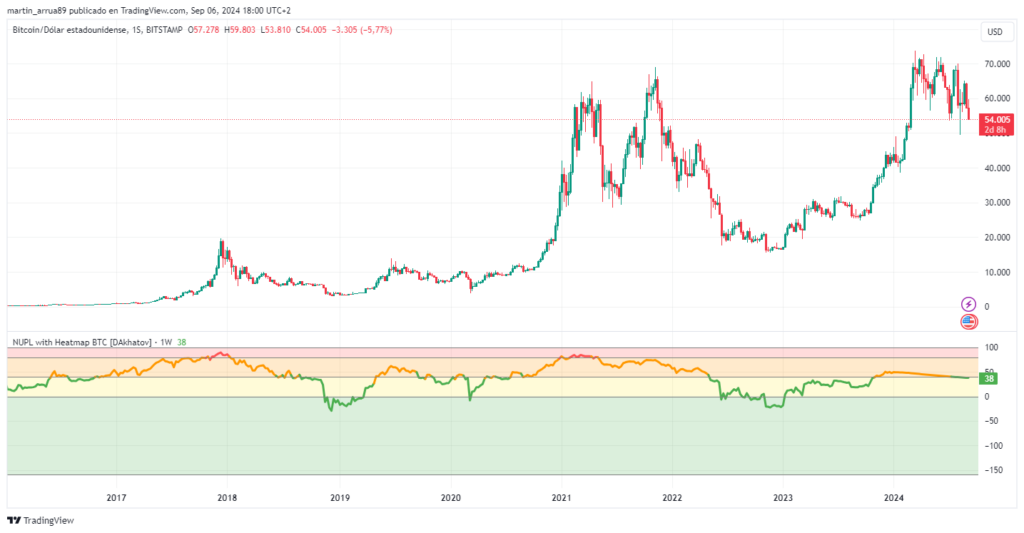
The NUPL is represented by the line that runs through the colored areas. Source: TradingView.
Now it is worth asking how the NUPL is obtained and what each of its values means.
First and foremost, it is important to note that the NUPL is calculate from the difference between the market value and the realized value of BTC or a Cryptocurrency, divided by its market cap.
When we talk about “market value”, we refer to the current price of bitcoin multiplied by the total amount of coins in circulation.
In trading, “realized value” is the difference between the initial purchase price and the current price. For example, if an investor bought BTC at $10 and sells it for $25, the “realized value” would be $15.
If the NUPL is located in the dark green zone of the above chart, it suggests that investors are taking losses. For some, it can be taken as a possible point to buy BTC.
In the light green zone, from -0.5 to 0, it reflects a bearish sentiment although the situation would not be so critical.
In the yellow zone, from 0 to 0.75, it is usually considered an opportunity for those investors who bet on the long term, it indicates moderate profits and the possibility of sustained growth. As seen in the graph, the NUPL is 0.38, so there are good projections for the futurereflecting a moderate optimism in the financial markets. Moreover, if one takes into account the patterns that the indicator has followed throughout history, the market is on the verge of a new bullish cycle.
The red zone, from 0.75 to 1, indicates that investors are in a selling zone and it could be time for a market correction.
In this regard, SantinoCripto, a renowned cryptocurrency analyst at X, consider which is a key indicator that “clearly shows us that we have never seen a bullish market top” and adds: “When we enter the red zone, it will be time to sell. For now, we still have a long way to go, at least to $120,000 or $140,000.”
However, it should be noted that NUPL is just one indicator that provides potential investment opportunities. Beyond opinions like SantinoCripto’s, it is essential to investigate and consider factors to make responsible decisions.
Crypto Keynote USA
For the Latest Crypto News, Follow ©KeynoteUSA on Twitter Or Google News.

